Pulling Controller Log Files within Mosaic 1.X
Mosaic Designer 1.X
Viewing a controller’s log via the WebUI
Within the Network Tab, you’ll need to select the controller that you wish to pull the logs for.Then click the “Web Interface Button” .
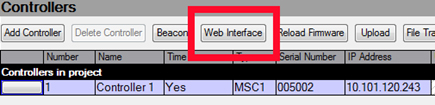
Be aware, the controller will need to be online in order to access the WebUI.
Once you click the Web Interface button the Mosaic Web Interface will launch in your default internet browser, it is recommended that you use Internet Explorer for this.
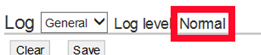
Click on the “Log” button at the top of page

You will now see all of the controller’s actions since the last reboot. The current log level will be indicated in title block.
There are six total log levels that are available for various diagnostics purposes.
Critical, Terse, Normal, Extended, Verbose, and Debug
Critical errors require immediate attention.
Terse errors are reported for events that indicate problems, but do not require immediate attention
Normal errors are reported to alert users to potential problems.
Extended reporting offers non-critical information to the administrator.
Verbose reporting will give you detailed information on the controller’s actions. (e.g. Timeline actions and incoming data)
Debug is a highly detailed logging level and contains all controller information. This level is only recommended when users are doing high level troubleshooting.
Controllers should not be left in debug mode for normal operation.
You also have the ability to view the log as “General” or “System Log”
General is a step-by-step account of all activity including input/output. For example, RS232 serial strings, and trigger matching.
It is extremely useful in helping debug complex interfacing and triggering arrangements.
System is a less verbose log of the Controller's system activity; it is useful for examining the boot-up sequence to help debug problems.
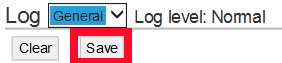
Once in the WebUI, you will have the option to either save or clear the logs.
To save the logs click on the save button.
This will open a save dialogue. Be sure to save the file with a .TXT extension.
For readability sake, I’d recommend using Notepad ++ to read the logs.
To clear a controller’s log, hit the clear button.
WARNING: There is no way to undo action, once a controller’s log information has been cleared, it is unrecoverable.
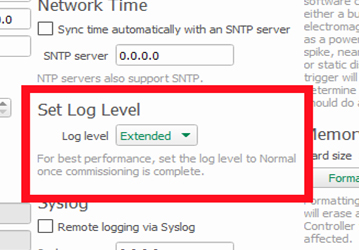
Changing A controllers Log level
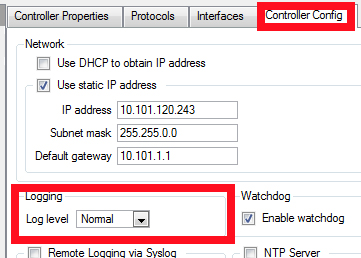
Log levels can be changed via the controller configuration pane within the Network Tab.
Be sure to apply changes via the commit button in the lower left corner.
To change a controllers log level right click on the controller within the network tab and select “Configure”
Be sure to click “Apply” before exiting.
Viewing a controller’s log via Mosaic Designer
Logs can also be viewed for specific controllers from within Mosaic Designer by going to the view menu and clicking “Controller Log Window”
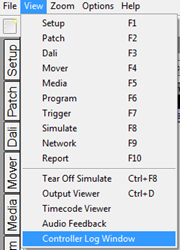
Be aware, logs are not able to be saved from this window; this is a view and clear only section.
Remote Logging via Syslog
To enable remote logging via a specified IP address, you must first specify the IP address of the server and enable the function. This feature is enabled and configured via the controller configuration page.
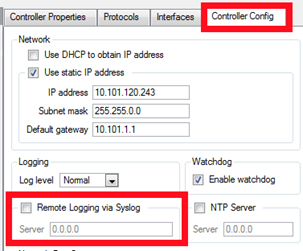
WARNING: There is noticeable performance impact when using Syslog. This feature is recommended only to be used for debugging purposes.