Mosaic Designer Reports
What Are Mosaic Reports?
Mosaic Designer has an extremely powerful reports feature built into the base software.
Reports are designed to give a detailed summary of all parts of the Mosaic project.
Reports can then be exported as an ODS file or printed for use outside of Mosaic Designer.
Accessing Reports
Reports can be viewed by navigating to the Project tab and choosing the "Reports" button from the top toolbar.

Clicking this button will generate the reports window
Reading Reports
There 9 tabs within the reports window
- Equipment
- Group
- Layout
- All Layouts
- Patch
- Timeline
- All Timelines
- Trigger
- Network
Columns within reports can be re-arranged by clicking and dragging a column to its new location.
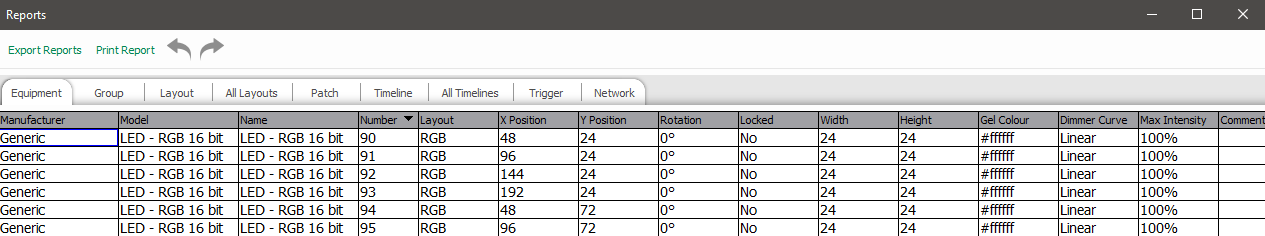
The Equipment Tab
The equipment tab gives a detailed listing of every fixture with in the Mosaic project.
Information such as manufacture, model, name, and fixture number are all found within this screen.
Additional information regarding position, gel color, and any custom properties can be viewed here.
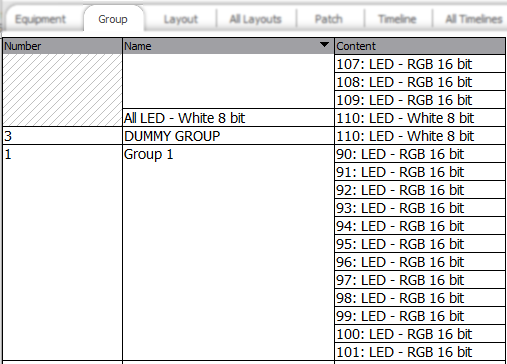
The Group Tab
The group tab will show all groups with in the configuration, their contents, and the group's number.
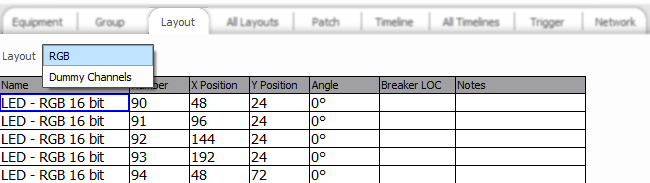
The Layout Tab
The layout tab gives information about all fixtures on a specific layout.
The viewed layout can be changed by clicking on the drop down menu and selecting the appropriate item.
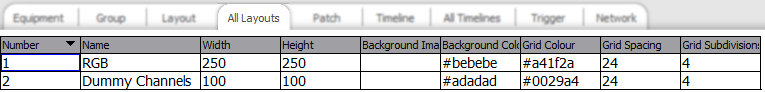
All Layouts
The all layouts tab gives an overview of all layouts within the project.
A layouts dimensions and grid spacing are all visible here.
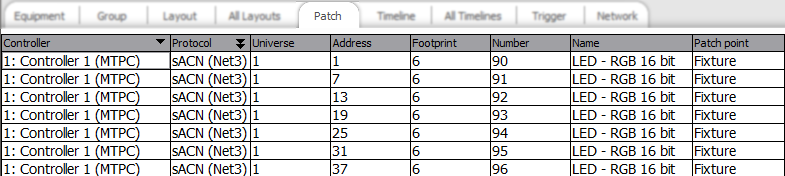
Patch
The patch tab shows a what controller a fixture is patched to, its universe, address, footprint and the fixtures number.
Timeline
The timeline tab gives a very detailed overview of each timeline within the configuration.
To change the viewed timeline, click on the dropdown menu and select the next timeline.
A timeline's start, end, fade, and skew properties are all viewed here. Additionally, information about the affected group and preset type are visible within this tab.

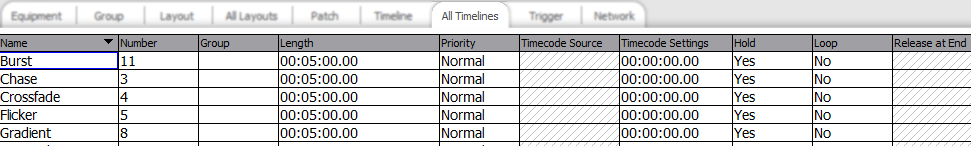
All Timelines
The all timelines tab gives an overview off all timelines.
A timeline's name, number, priority, length, and release properties are located here.
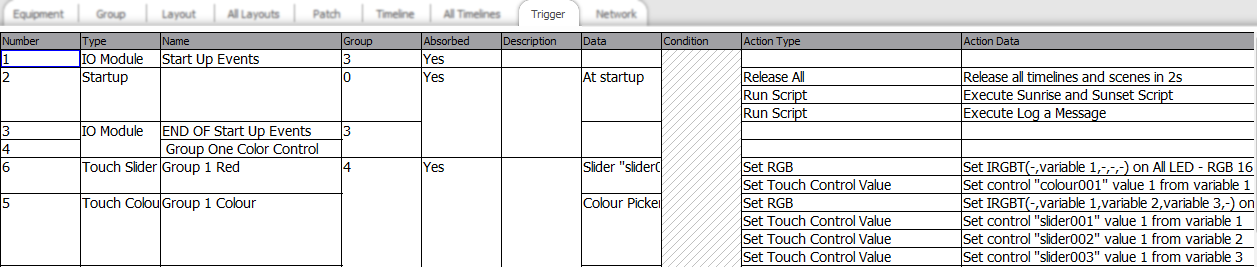
Trigger
The trigger tab lists detailed information about each trigger, including it's name, type, group and associated action and conditional data.
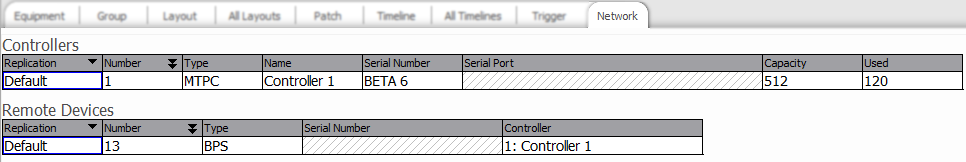
Network
The network tab offers an overview of all controllers and RIOs within the project showing their type, serial number, and capacity.
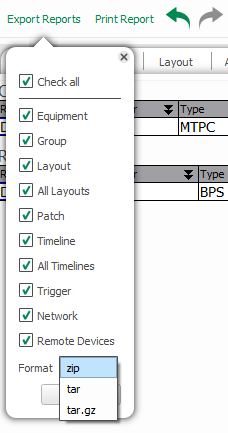
Exporting and Printing Reports
Reports can be exported by clicking on the "Export Reports" button in the upper left of the reports window. Reports are exported on a per tab basis. Once a selection is made reports are compressed into one three file compression formats; zip, tar, or tar.gz.
Reports can be printed to by clicking the "Print Reports" button.
To finalize the export, click the "Export" button underneath the format selection area. This will allow you to save the compressed folder to any location on your computer.
Be aware, opening the compressed file requires a program such as Winzip or 7zip. Reports are saved as an .ODS file format and can be opened using any spreadsheet program.