Pulling Controller Log Files within Mosaic 2.X
Mosaic Designer 2.X
Viewing a controller’s log via the WebUI
Within the Network Tab,you’ll need to select the controller that you wish to pull the logs for. Then click the “Web Interface Button”.

Be aware, the controller will need to be online in order to access the WebUI.
Once you click the Web Interface button, the Mosaic Web Interface will launch in your default internet browser, it is recommended that you use Internet Explorer to view this interface.
Click on the “Log” button at the top of page

In Mosaic 2.0 there are number of ways to filter logs. You have the ability to filter logs by type, level, and text.
You can filters your logs by the following parameters: System, Project, Time, Output, I/O, Trigger, Script, and DALI You also have the ability to view different log levels from within the WebUI.
Your current controller log level will be indicated on the upper left corner of the screen.
Note: Changes made to log level here are not permanent. This is a filter option only.
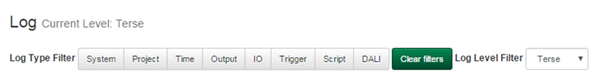
You also have the ability to filter the logs by text. For example if we are looking for information related to our “Color on Color” timeline we can simply type “Color on Color” (the timeline name) into search box and see all relvant information about that timline and assocaited triggers.
Logs can be saved via the WebUI using the save function located in the upper left corner.
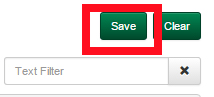
These files are saved as .TXT file and can be viewed with any plain text editor. For readability sake, I’d recommend using Notepad ++ to read the logs.
To clear a controller’s log, hit the clear button.
WARNING: There is no way to undo action, once a controller’s log information has been cleared, it is unrecoverable.
Changing A controllers Log level
There are six total log levels that are available for various diagnostics purposes: Critical, Terse, Normal, Extended, Verbose, Debug
- Critical errors require immediate attention (Log Level: 0)
- Terse errors are reported for events that indicate problems, but do not require immediate attention (Log Level: 1)
- Normal errors are reported to alert users to potential problems (Log Level: 2)
- Extended reporting offers non-critical information to the administrator. (Log Level: 3)
- Verbose reporting will give you detailed information on the controller’s actions (Log Level: 4)
- Debug is a very detailed log level. This level is only recommended when users are doing high level troubleshooting. (Log Level: 5)
Controllers should not be left in Debug mode for normal operation.
To change a controllers log level right click on the controller within the network tab and select “Configure”

Be sure to click “Apply” before exiting.
Viewing a controller’s log via Mosaic Designer
Logs can also be viewed for specific controllers from within Mosaic Designer. Select Select the menu in the upper right corner and click “Controller Log Viewer”
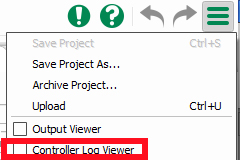
Be aware, logs are not able to be saved from this window; this is a view and clear only section.
Remote Logging via Syslog
To enable remote logging via a specified IP address, you must first specify the IP address of the server. This feature is enabled via the controller configuration page accessed by right clicking on a controller within the network tab and right clicking “Configure”
WARNING: There is noticeable performance impact when using Syslog. This feature is recommended only to be used for debugging purposes.