The Hog 4 Toolbars
Question
Hog 4 contains numerous toolbars: the View Toolbar, the Window Control Toolbar, the Playback Bar, the Main Toolbar, the Open Toolbar, the Encoder Display/Wheels Toolbar and more. Where are they and how are they accessed?
The Toolbars
View Toolbar: the View Toolbar displays recorded views and allows the user to scroll through their various views. A show may have 100 views that can be paged through in the toolbar, and two screen consoles will have 4 additional views that are not page-able.

Playback Bar(s): the Playback Bar(s) are graphic views of data stored onto the Playback Masters. Playback Masters are page-able, with an unlimited number of pages, with 90 Masters available over 9 bars. By default, Playback Bar 0 is displayed and mapped and docked to a console's physical masters. Additional bars may be enabled for external wings, virtual wings, or to be docked to the console's physical masters. For information on mapping Playback Bars, check out Map Wing to a Playback Bar
Playback bars may be hidden or revealed, to best utilize limited screen space, by holding Pig and pressing numbers 0 through 8. For more information, check out The Playback Bar or the Encoder Wheel Toolbar are gone

Window Control Toolbar: the Window Control Toolbar is where the console's manual may be accessed, along with various window configuration buttons such as Size, Move and Close. Some consoles have more buttons in their Window Control Toolbars than others.

Encoder Wheel Toolbar/Wheels Toolbar: the Encoder Wheel Toolbar/Wheels Toolbar (names are interchangeable) is where the encoder mappings are displayed, along with the Enable, Mode and Control kind buttons. Nothing data is displayed unless fixtures are selected.
On consoles with limited screen real estate, the Encoder Display may want to be hidden. To do this, hold Pig and press the "." key. For more information, check out The Playback Bar or the Encoder Wheel Toolbar are gone

Slot Toolbar: the Slot Toolbar appears when the selected fixtures have slotted parameters, such as a color wheel, gobos, prisms, etc. It appears in the same space as the Encoder Wheel Toolbar, but when a slotted parameter is selected, the slotted values appear for quick selection.

Paths Toolbar: the Paths Toolbar appears only when editing timing values via the Encoder Wheel Toolbar

Command Line Toolbar: the Command Line Toolbar is the data displayed to the right of the Command Line. Data displayed there here include:
- Task Status Icon: turns red when a task fails
- Keystroke Macro Status Icon: indicates when a keystroke macro is running
- Function Key Mode: indicates which function the Function Keys are in
- KIND: Function Keys are in User Kind mode
- CMD: Function Keys are in Command Key mode
- Kind Masking Mode: indicates whether additive kind masking (ADD) or subtractive kind masking (SUB) is enabled
- Chat Status: indicates if a new chat has been sent to the user
- Trackball Mode: indicates whether the trackball is in standard mode (---) or position mode (POS)
- Keyboard Mode: indicates whether
- Current Page: indicates which page the Playback Masters are on
- Active Editor: indicates the editor that manual data is being entered into
- Chosen Master: indicates which master is chosen
- Network Status Icon: indicates if the console network has encountered any issues
- Time: the console's time as set in the Control Panel

Main Toolbar: the Main Toolbar displays below the Command Line and Status Bar and are the most variable. The default toolbar contains the Select, Segments, Touch, Suck, Out, Rem Dim, Knockout, Flip, Unblock, Undo, Park, Renumber and Backup buttons (some console set ups display additional buttons). By pressing different buttons, this toolbar changes to the Select Toolbar, the Segments Toolbar, the Setup Toolbar, the Open Toolbar and the Record Options Toolbar.

Select Toolbar: the Select Toolbar is shown after pressing Select... in the Softkey Toolbar. The options here are used to change which fixtures are selected in the active editor.

Segments Toolbar: the Segments Toolbar is shown after press Segments... in the Softkey Toolbar. The options here are used to enable segmenting and buddying.

Setup Toolbar: the Setup Toolbar is shown after pressing Setup. From here, Control Panel, Preferences, the Network Window, the Shows Window, the Fixtures Window, various diagnostics windows, Lock and Quit are accessible.

Open Toolbar: the Open Toolbar is shown by holding Open. From here, windows that do not have hard keys are able to be opened.

Record Options Toolbar: the Record Options Toolbar is shown after pressing Record, Merge, or Copy. From here, recording options such as tracking, palette rules, masking rules, inserting, merging or replacing are available.

Update Toolbar: the Update Toolbar resembles the Record options Toolbar, except with many of the buttons unavailable. This is accessible while holding the Update button.

Timecode Toolbar: the Timecode Toolbar may be displayed to have a view of timecode coming into the console. To enable or disable Timecode Toolbars, press Setup, Network, select the applicable console (if using MIDI timecode) or processor (if using Linear Timecode), and after adding the timecode device and applying the changes, press the View Toolbar button for the applicable timecode device.

Clock Toolbar: the Clock Toolbar may be displayed to have a view of the date and time, along with when the next cue will trigger from the clock, and what the cuelist and cue number are. To view or hide the Clock Toolbar, hold Open to display the Open Toolbar, and press Clock.

Options Toolbar: the Options Toolbar displays when holding Choose for a playback master. Depending on what is on the master will change what options are displayed. The options displayed are connected to the equivalent option in the applicable options menu.
- Holding Choose for a List will provide access to a list's Priority, Persist On Override, Release On Other Go, Use HTP, Is Chase, Reset On Release, Cue Only, Mark New Cues, Playback Mask and release time options.

- Hold Choose for a Scene will provide access to a scene's Priority, Persist On Override, Release On Other Go, Use HTP, Playback Mask and release time options.

- Hold Chose for a Batch will provide access to a batch's Show details option.

- Hold Choose for an Inhibitive Submaster will provide access to an inhibitive submaster's release time.

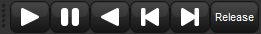
Play Controls Toolbar: the Play Controls Toolbar is only available in a list's, scene's and batch's window when the Play Controls button is enabled. The toolbar gives access the playback's Go, Halt, Back, Skip Back, Skip Forward and Release keys, and will always act as those commands, independent of the playback key mappings.
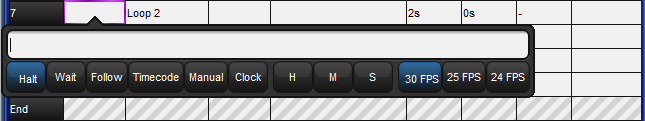
Trigger Toolbar: the Trigger Toolbar is opened by pressing Set after selecting a cue's Wait cell. This toolbar provides the various trigger options for a cue, including wait time, follow time, timecode or clock times, or the need to manually trigger advancing the cuelist. To close the toolbar, press enter.
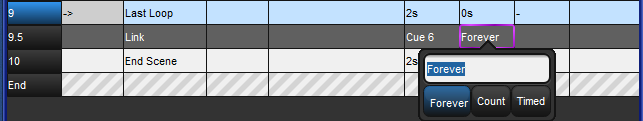
Loops Toolbar: the Loops Toolbar is used to set the exit for a loop in a cuelist. To open the Loop Toolbar, select the Delay cell in the Link Cue and press Set. Options are to loop forever, loop a defined number of counts, or loop for a defined time duration. To close the toolbar, press Enter.
Jump Toolbar: the Jump Toolbar is available in editor windows (such as the Programmer, Cue Editor, etc.) to quickly move to a fixture type. This is especially useful when a long list of fixtures is in a show.

Debug Toolbar: the Debug Toolbar is opened by holding Pig and Open, and pressing the 5 key. To hide the toolbar, press the Close button in the toolbar.

Single Screen Console Layout
Depending on your screen configuration (single screen console or two screen console, some bars may move around.
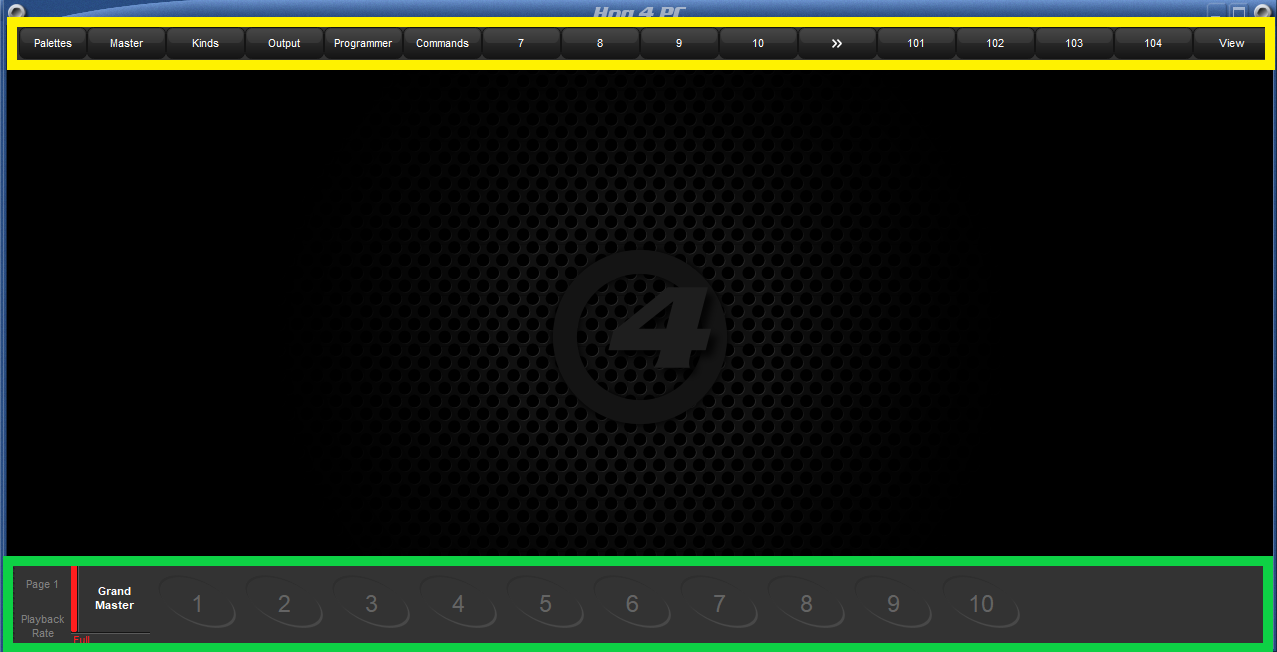
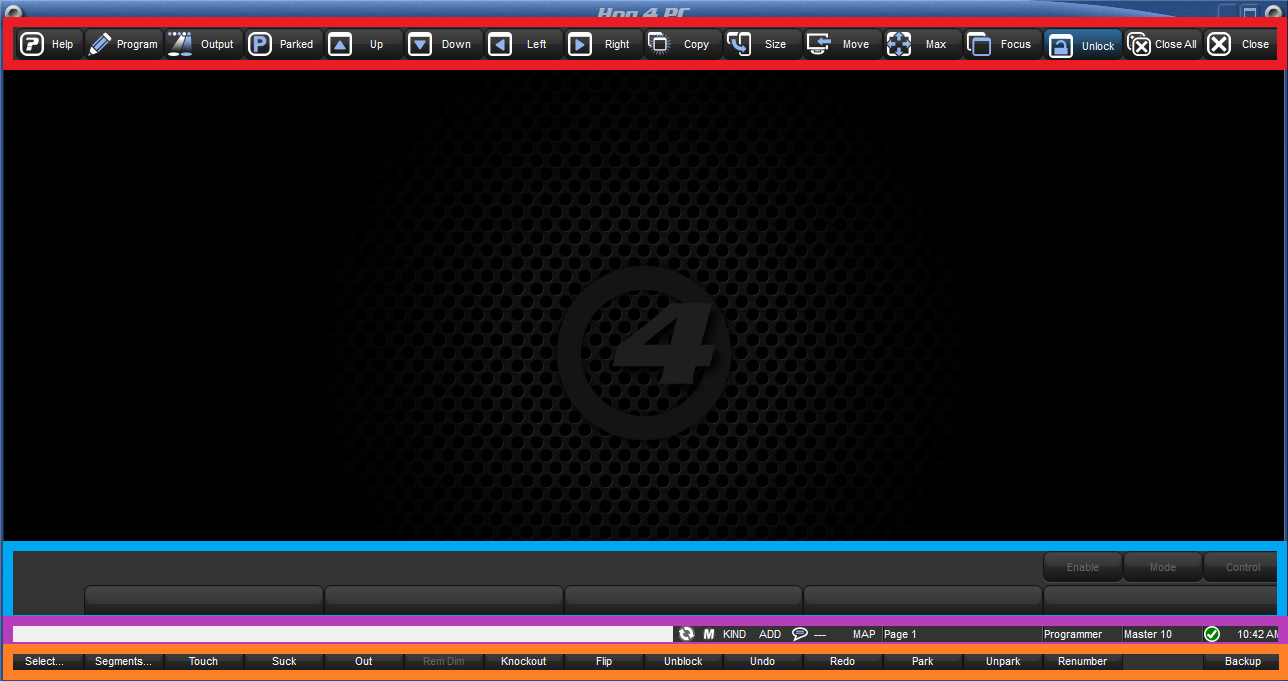
On a single screen console, the default view when a showfile is created looks like:
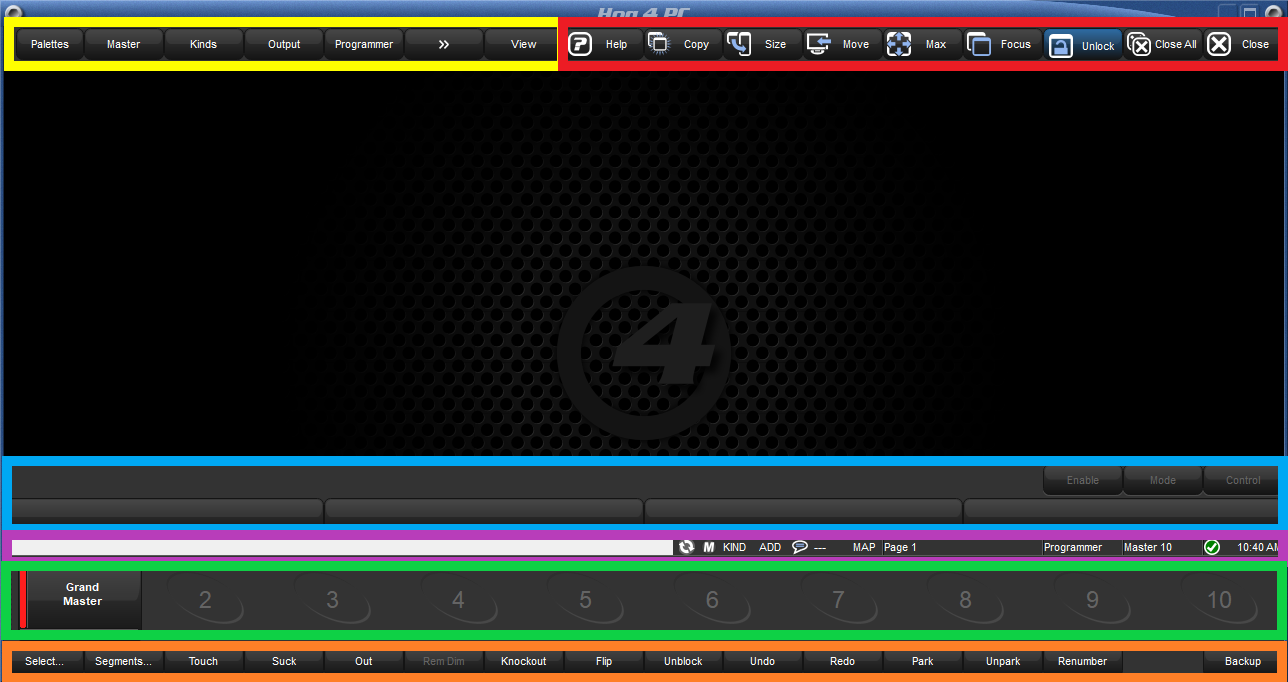
The yellow box indicates the location of the View Toolbar.
The red box indicates the location of the Window Control Toolbar.
The blue box indicates the location of the Encoder Wheel Toolbar and the Slot Toolbar (when applicable).
The purple box indicates the location of the Command Line Toolbar.
The green box indicates the location of the Playback Bar.
The orange box indicates the location of the Main Toolbar, which may become the Select, Segment, Setup, Open, Record Options, or Options toolbars.
The default positions for the Timecode, Clock and Debug Toolbars are directly under the View and Window Control Toolbars, with the latest toolbar to open at the bottom of the stack.
Two Screen Console Layout
On a two screen console, the default view when a showfile is created looks like:
The yellow box indicates the location of the View Toolbar.
The red box indicates the location of the Window Control Toolbar.
The blue box indicates the location of the Encoder Wheel Toolbar and the Slot Toolbar (when applicable).
The purple box indicates the location of the Command Line Toolbar.
The green box indicates the location of the Playback Bar.
The orange box indicates the location of the Main Toolbar, which may become the Select, Segment, Setup, Open or Record Options toolbars.
The default positions for the Timecode and Clock Toolbars are directly under the View Toolbar, with the latest toolbar to open at the bottom of the stack.
The default position for the Debug Toolbar is directly under the Window Control Toolbar.